Interactive Map
Interactive Map
Section titled “Interactive Map”The Interactive Map is the core feature of the EarthTeam web platform. Built on Mapbox GL JS with React wrappers, it renders conservation projects and wildlife crime incidents as clustered markers on a 3D globe. Users can switch between satellite and terrain views, toggle between Solutions and Wildlife maps, search for projects, and explore details through popups and drawer panels.
Key Capabilities
Section titled “Key Capabilities”Map Display
Section titled “Map Display”- 3D Globe Projection — Auto-rotating globe with atmosphere effect, pauses on interaction
- Satellite & Terrain Views — Toggle between aerial imagery and topographic map styles
- Dark/Light Mode — Separate light-map page with dark/light toggle and night lights heatmap
- Great-Circle Connection Lines — Animated route lines between location pairs using Turf.js
Marker System
Section titled “Marker System”- Proximity Clustering — Mapbox GL cluster functions with count labels and click-to-expand
- Category Coloring — 7 project-type categories with distinct marker colors
- Custom Popups — Rich info cards on marker click with organization, region, and links
- Recommendations Panel — Same-organization project recommendations on marker click
Map Controls
Section titled “Map Controls”- Map Type Toggle — Optimistic toggle between Solutions Map and Wildlife Incidents Map
- Layer Control — Satellite vs. Terrain popover selector
- Zoom Controls — Custom zoom in/out buttons on the map
- Legend Box — Dynamic legend switching between Solutions and Wildlife icons
- Sidebar Panel — Vertical icon bar: Legends, List View, Add Solution, ET Star, Help, Terms
Search & Filter
Section titled “Search & Filter”- Search Bar — Backend-powered post search with debounced text input
- Category Filtering — Real-time marker filtering by project type via URL params
- Country Filtering — Filter by country via URL query params
Responsive Design
Section titled “Responsive Design”- Desktop — Full sidebar, drawer panels, recommendation cards
- Mobile — Bottom toggle button, bottom tab bar, responsive popups
Screenshots
Section titled “Screenshots”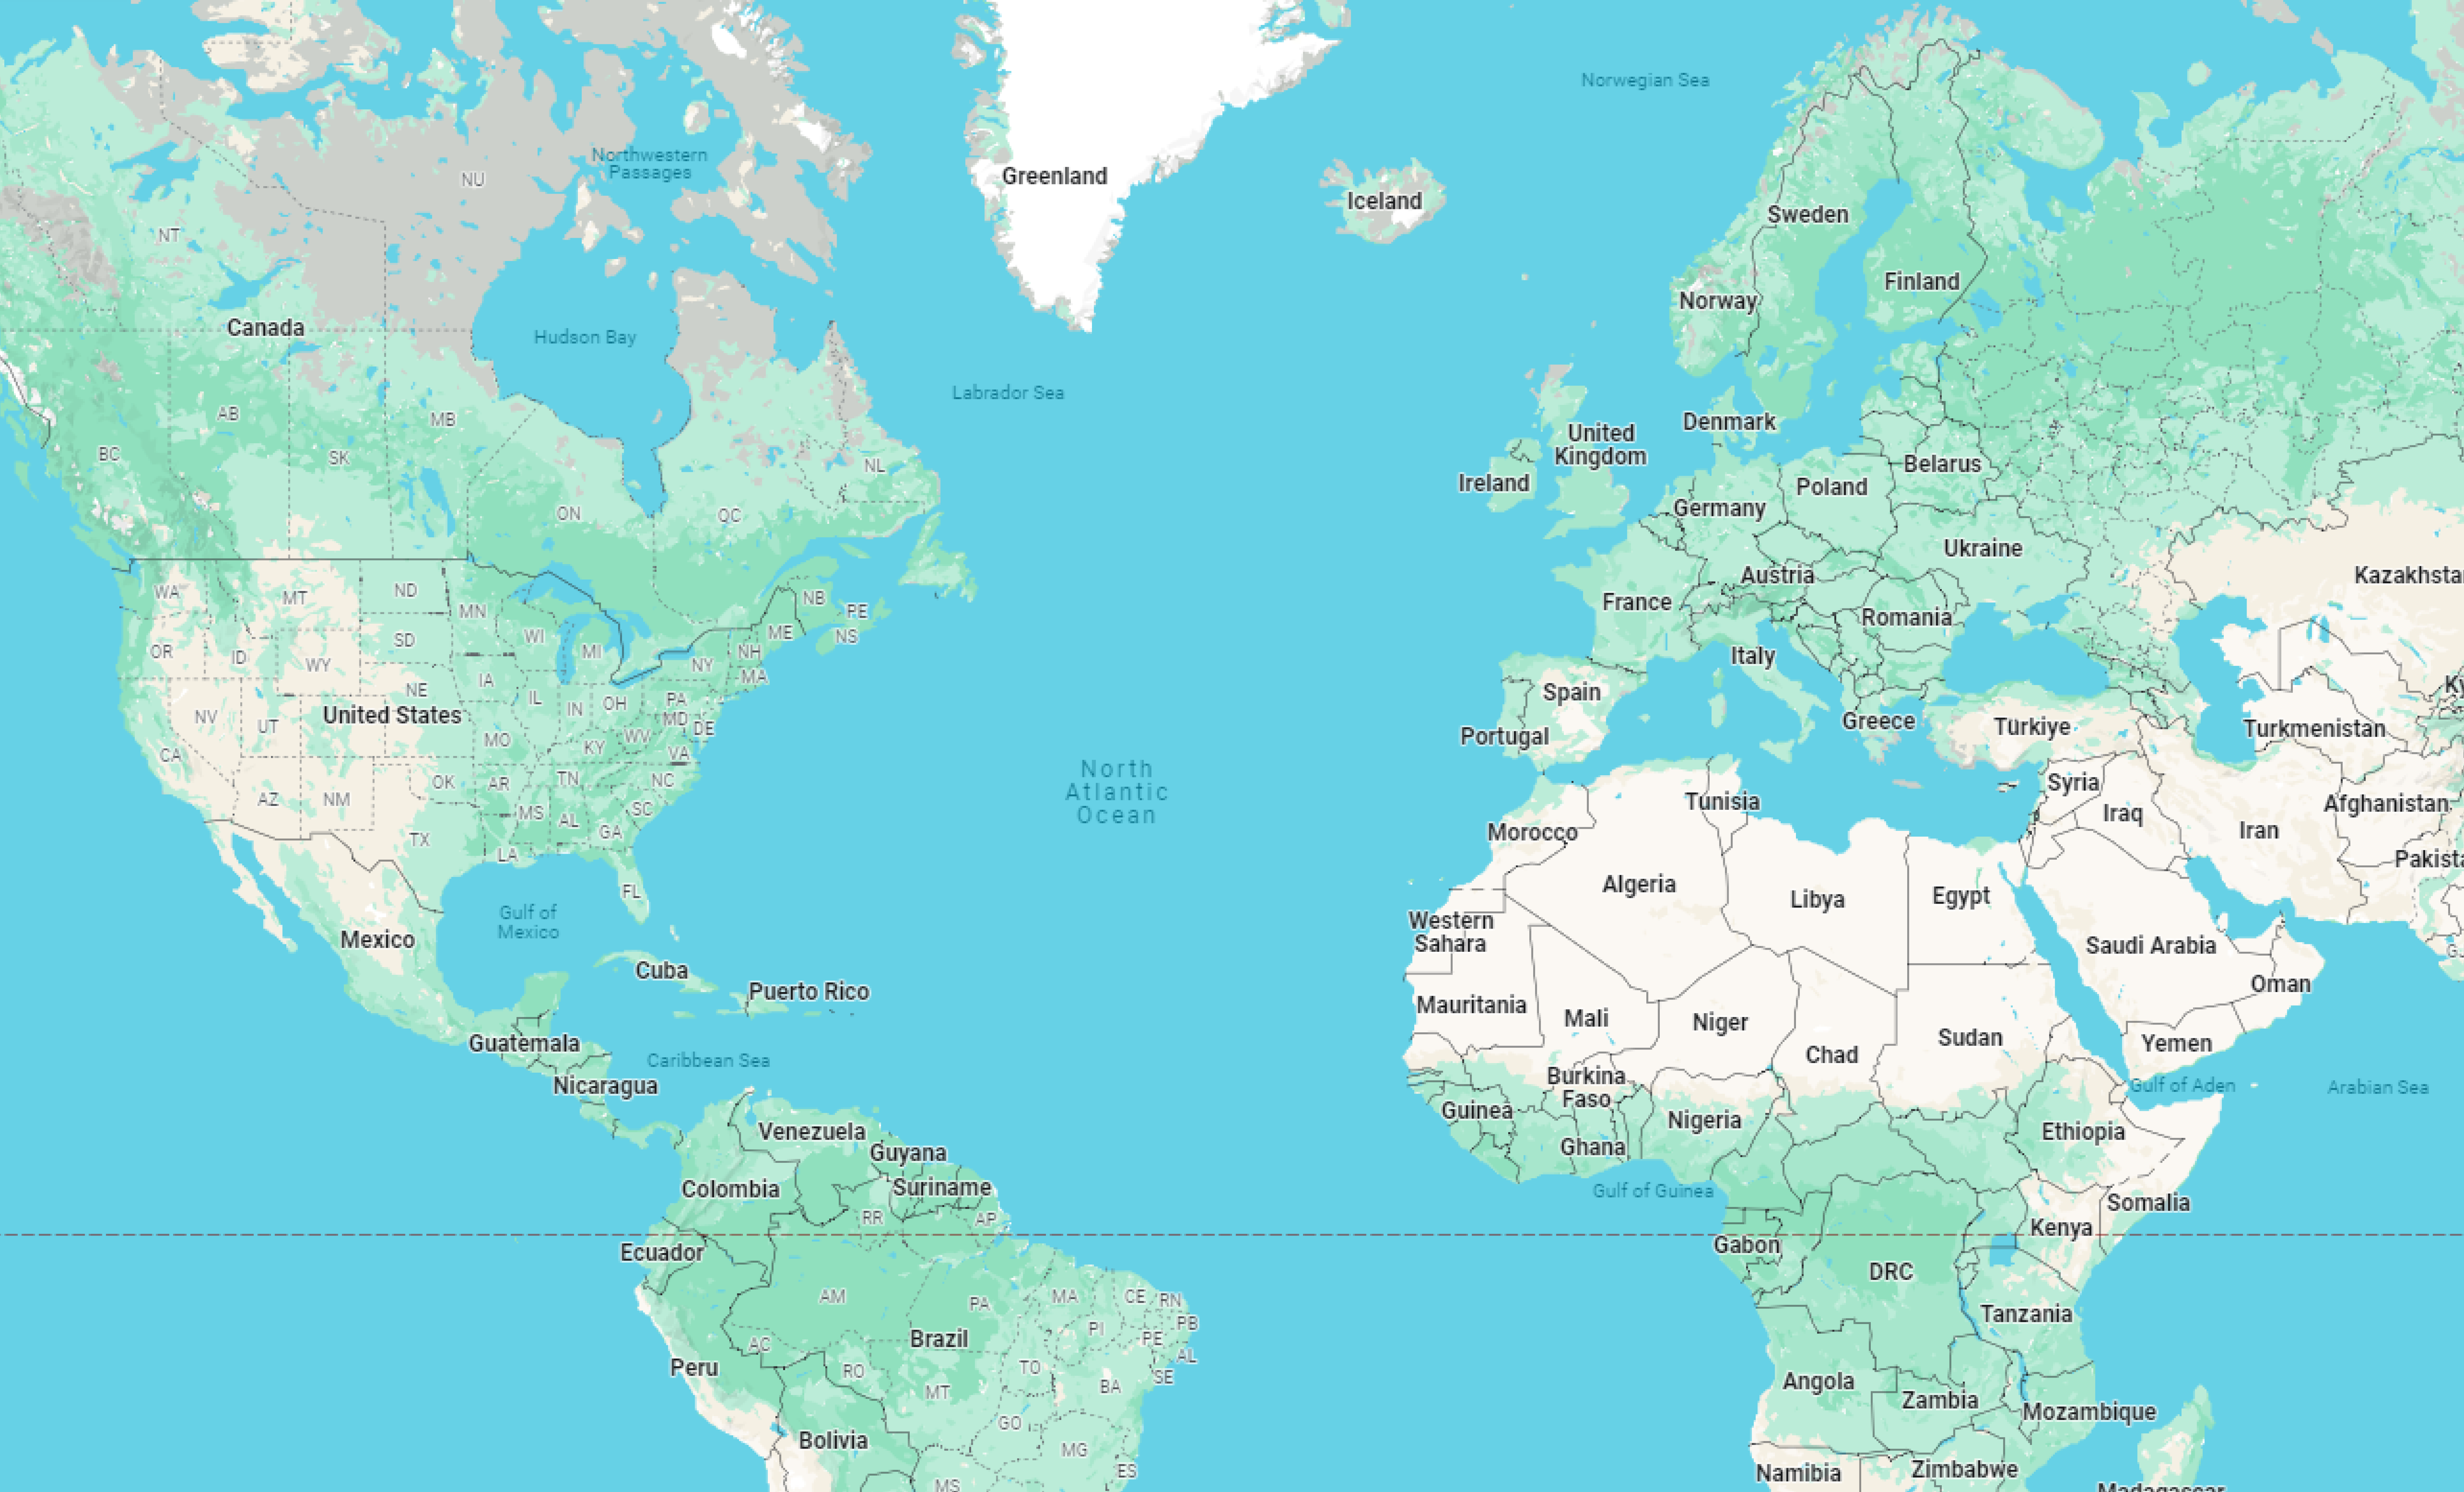

Map Legend Icons
Section titled “Map Legend Icons”How It Works
Section titled “How It Works”The Interactive Map loads data from the EarthTeam servers and displays conservation projects and wildlife incidents as color-coded markers across a 3D globe. When you open the map, markers are automatically clustered by proximity so you can see the big picture at a glance. Click any cluster to zoom in and reveal individual markers, then click a marker to see a popup with the project’s name, organization, region, and a link to learn more.
Use the map type toggle to switch between the Solutions Map (showing conservation projects) and the Wildlife Incidents Map (showing reported wildlife crime events). The layer control lets you switch between satellite imagery and terrain views. The search bar at the top helps you find specific projects by name or keyword, and the sidebar provides quick access to the legend, a list view, and other tools.
On desktop, markers and popups appear alongside a sidebar with recommendation panels that suggest related projects from the same organization. On mobile, the interface adapts with a bottom tab bar and touch-friendly controls.
Related Features
Section titled “Related Features”- Posts & Solutions — Post detail drawer and add/update solution
- Mobile Map Explorer — Same map on the mobile app
- List View — Alternative list-based browsing